12 December 2019 | RESOURCES

Qlik NPrinting: Simple report layouts

Qlik NPrinting lets you create complex and attractive reports using your Qlik data. You can share Qlik insights using the same Qlik visualisations that are contained in your Qlik applications, or you can create new visualisations or tables using native Microsoft Office, or NPrinting Pixel Perfect capabilities.

Read on for tips and tricks around NPrinting report layout.

Working with Chart images:

Import images of charts that you wish to display in the report with the same formatting that you have in your Qlik application.

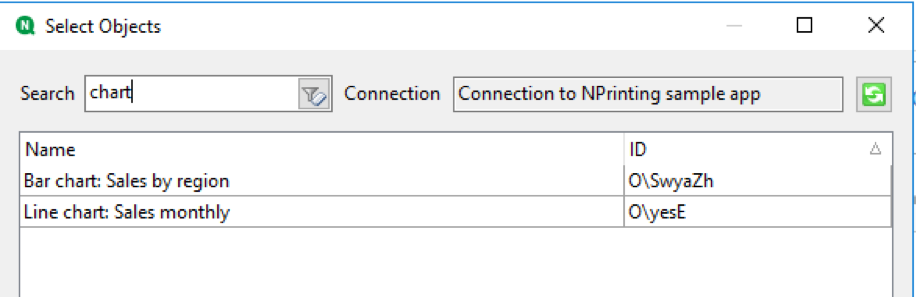
We recommend that you give the charts in Qlik friendly names, this then makes them easier to work with in NPrinting. You can search by name or object ID to find the chart you want to import:

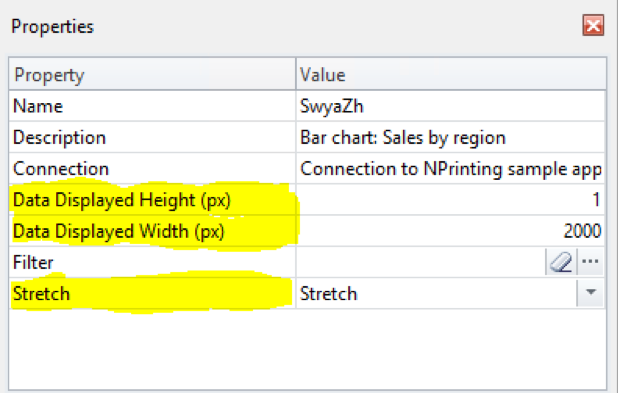
Adjust the size of the placeholder that is created in the report, so that it is positioned where you need it and is the size required. 

Then adjust the Data displayed height and width settings with the Stretch setting set to ‘Stretch’ to control the zoom of the image.

This allows the entire chart to be displayed in NPrinting, even if you see a scroll bar in the Qlik app as there are too many data points to display in the chart on screen.

When outputting the report to PDF, we recommend you set the image quality to ‘Very high’ so that the images are as clear as possible.

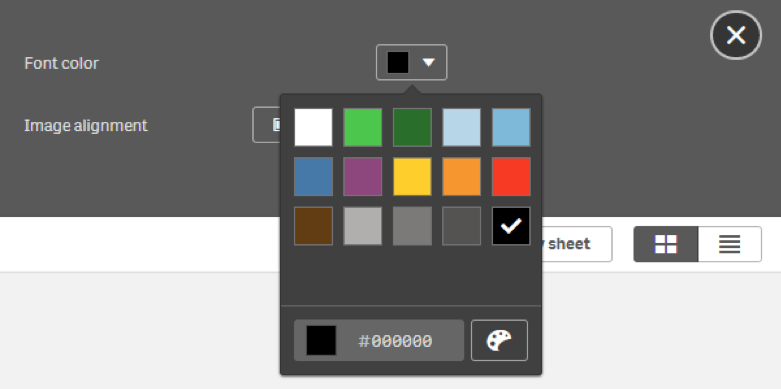
Sometimes chart labels appear hard to read as they are light grey when using the default font colour in Qlik Sense. You can set the font colour in the Qlik app to black to make the labels stand out more in the NPrinting report (note – this will change the font colour in the entire Qlik app).

Working with tables:

Straight tables and pivot tables can be imported into NPrinting as images. These will display exactly as they do in the Qlik app, cannot be formatted and can be hard to read.

Therefore, we recommend creating tables in NPrinting directly instead.

Straight tables are the most flexible to work with.  

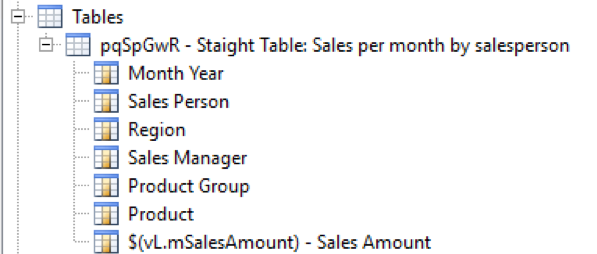
When you add a straight table into the tables section in NPrinting, each column is imported separately. You can then create a native excel or word table and drag and drop the columns you require into the position you need them to be in (doesn’t need to be the same position as the app, and you don’t need to use all columns).

Be aware that if you are using a measure which contains an expression (not a variable) and then subsequently change the expression, the column will not be found in NPrinting after refreshing the cache and you will need to re import the column. This is another reason that we always recommend that you use variables to contain your expression definitions (if you change the underlying expression contained in the variable NPrinting won’t be affected).

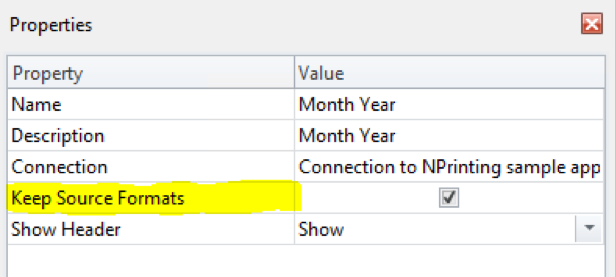
You can configure properties across the entire table, or for each column individually.

If you check the ‘Keep Source Formats’ box, then any conditional colouring in Qlik will be utilised by NPrinting, however you will be unable to change the column size, font or font size. Therefore, we recommend that you un-tick the ‘Keep Source Formats’ box and do any formatting using NPrinting designer instead.

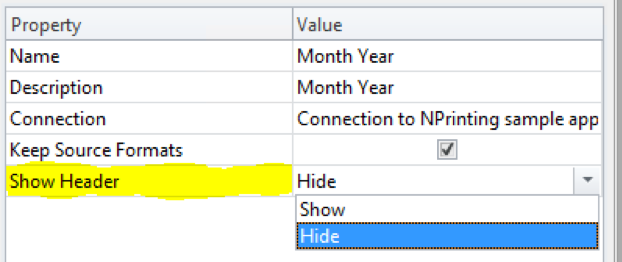
By hiding the header row, you can add custom column headings in NPrinting. Change the ‘Show Header’ property to ‘Hide’.

Pivot tables: When you import a Qlik pivot table into NPrinting, the table is imported as a whole, rather than each column getting imported separately. There are fewer formatting options available in NPrinting when using a pivot table compared to a straight table. 

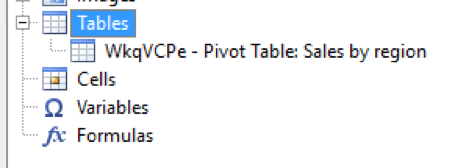
We recommend using straight tables where possible, and then using native Microsoft Office functionality to create pivot tables from the data using NPrinting.

Be aware that if you use show conditions on columns in a Qlik straight table, then the table will be treated the same as a pivot table in NPrinting (with reduced formatting options).

Download PDF of the article

TAGS | Financial Services|Retail|Government|Transportation Warehousing and Distribution|Education|Manufacturing and Construction|Utilities|Health|Qlik

You may also be interested in

25 October 2023 | NEWS

5-6 min read

Healthcare Analytics: Te Whatu Ora – New Zealand Health Partnerships

The organisation needed to pull that data together to provide a national view: it went live in 2021 with an analytics tool and a data platform and rapidly stood up the data pipelines to all ERP systems.

LEARN MORE

25 October 2023 | NEWS

5-6 min read

Healthcare Analytics: Te Whatu Ora, Capital, Coast, Hutt Valley and Wairarapa

Data literacy is the ability to read, work with, analyse and communicate with data. Data literate staff understand what questions to ask and how to get true benefit from available data.

LEARN MORE

25 October 2023 | NEWS

5-6 min read

Healthcare Analytics: Te Whatu Ora – Health New Zealand, Counties Manukau

Users can see in real time, at a glance the overall hospital occupancy and a simple traffic light system provides an overview of performance.

LEARN MORE

24 October 2023 | NEWS

5-6 min read

Healthcare Analytics: Northern Region Health Coordination Centre (NRHCC)

The Covid-19 Dashboard was used to support Covid-19 testing, vaccination, managed isolation and community care and is being expanded to other areas such as planned care, pulling from national datasets.

LEARN MORE

7 October 2023 | NEWS

45 min read

Healthcare Analytics in Aotearoa New Zealand

A Special Report on Healthcare Analytics in Aotearoa NZ – recognising the successful use of data analytics to drive better outcomes for the health of all New Zealanders.

LEARN MORE

24 September 2023 | NEWS

2 min read

Modernisation key to fix crumbling health IT infrastructure

Te Whatu Ora is making clear choices about national platforms. Leigh Donoghue gave the example of the new National Data Platform, which is being built on Snowflake.

LEARN MORE

16 August 2023 | NEWS

2 min read

Work begins on National Data Platform

The project will create a common platform for national data sets, which are currently dispersed across many platforms. Over time, the NDP will connect the health system’s multiple data environments.

LEARN MORE

12 August 2023 | EVENTS

1 min read

HiNZ Digital Health Week NZ 2023

Join us at Booth 72 & 73. Digital Health Week NZ bring together all the key players within the digital health sector to plan, network and collaborate on the digital future of the NZ health system.

LEARN MORE

12 August 2023 | NEWS

2 min read

Te Whatu Ora taps Accenture and Acumen BI for National Data Platform development

Accenture has been selected in partnership with Acumen BI, as implementation partner for the National Data Platform (NDP), which will unify information held by more than 28 entities under the previous health system.

LEARN MORE

2 February 2023 | CUSTOMER STORIES

5 min read

Patient Reported Outcome Measures Programme

This project provides an opportunity to work with industry partners to develop analytical capability to link multiple data sets and use them predictively.

LEARN MORE

2 July 2022 | NEWS

3 min read

New Zealand Financial Intelligence Unit Data Update 2022

The FIU IQ platform has enabled us to view the data we receive in ways we were unable to before, however it has also highlighted data quality issues in the prescribed transaction reports.

LEARN MORE

28 June 2022 | CUSTOMER STORIES

6 min read

Tackling The Covid-19 Backlog: Data Driving Decisions

Waitemata DHB implemented Qlik to create a waitlist planning tool to help operations managers and clinicians manage the elective surgery backlog.

LEARN MORE

11 March 2022 | NEWS

2-3 min read

Acumen BI Shines for Qlik in Asia Pacific

Acumen BI, named data platform vendor Qlik’s Asia Pacific solution provider of the year. It’s the data, analytics and artificial intelligence expertise of its business intelligence unit that is increasingly attracting attention.

LEARN MORE

3 September 2021 | NEWS

1 min read

New Zealand Police Financial Intelligence Unit Update 2021

Examples of how the New Zealand Police Financial Intelligence will be able to produce new data visuals using Qlik and DataRobot.

LEARN MORE

3 August 2021 | NEWS

3 min read

NZ Police partners with Acumen BI

The New Zealand Police’s Financial Crime Group, The Financial Intelligence Unit (FIU) has partnered with Acumen BI as part of its Service Delivery Transformation Project.

LEARN MORE

11 June 2021 | NEWS

3 min read

Global report applauds NZ police, but advises financial intelligence unit boost

The New Zealand Police Financial Intelligence Unit was lacking analytical tools for all the data it gets, and so New Zealand company, Acumen BI, has been selected to provide a new suite of tools for the Unit to use.

LEARN MORE

4 June 2021 | CUSTOMER STORIES

4 min read

How New Zealand’s Transport Agency is Using Data for Transparency

Data and visualisation experts from Waka Kotahi – NZTA share how they partnered with Acumen BI and Qlik to build dashboards, and discuss some of their open data plans.

LEARN MORE

5 May 2021 | CUSTOMER STORIES

11 min read

Context is Everything When it Comes to Data Literacy

Our approach to data literacy at CCDHB sees us use Qlik Sense in an attempt to make complex data contexts transparent. The accessibility of data has supported business cases for required changes in staffing levels as part of the CCDM programme.

LEARN MORE

22 December 2020 | RESOURCES

1-2 min read

Putting AI Policy into Practice in Healthcare – with Rob O’Neill

Watch this video to see how AI will influence the delivery of care in the future. Understand the potential of AI as well as its constraints with examples of where AI policy has been put into practice effectively.

LEARN MORE

22 December 2020 | NEWS

30 min watch

Qlik November 2020 Release Now Available

What’s new in Qlik? Learn about; Qlik Sense SaaS, Qlik Sense Enterprise on Windows, Qlik NPrinting, Qlik Catalog, Qlik Replicate, and Qlik Compose for Data Warehouse.

LEARN MORE

29 October 2020 | NEWS

3 min watch

Qlik DataTransfer

Seamlessly and securely access your on-premises data in the cloud. Qlik DataTransfer is a lightweight utility that will securely push your on-premises data and local files into Qlik Sense® SaaS.

LEARN MORE

22 October 2020 | CUSTOMER STORIES

1 min read

Better Ward Visibility For Nurses

Capital & Coast DHB is providing nursing staff with better than ever ward visualisation. Learn how nurses and midwives can deliver superior patient care when data from numerous sources are delivered to one dashboard.

LEARN MORE

19 October 2020 | CUSTOMER STORIES

1 min read

eHealthNews Webinar

eHealthNews webinar: Business Intelligence driving healthcare transformation. This webinar explores examples of business intelligence tools in use in primary, secondary and tertiary care across New Zealand.

LEARN MORE

15 October 2020 | CUSTOMER STORIES

1 min read

NZTA uses Qlik to deliver open data

NZTA can easily drill down and uncover information about the quality of NZ’s state highway network, enabling more thorough and effective maintenance strategies. Explore NZTA’s Open Data Portal.

LEARN MORE

13 October 2020 | NEWS

30 min watch

The latest September Qlik releases are now available!

Innovations have arrived with the September 2020 releases from Qlik with the likes of conversational analytics, advanced analytics, and more.

LEARN MORE

7 October 2020 | RESOURCES

1 min read

Integrated Cloud Architectures – Webinar

Learn how to combine an automated data integration solution, a powerful cloud data platform and an intelligent analytics offering into an interoperable data pipeline.

LEARN MORE

7 October 2020 | RESOURCES

1 min read

Qlik Espresso Webinars

We get straight to the point with data integration, GeoAnalytics, Alerting, or AI – our experts explore a topic in 30 minute live webinars. We provide quick overviews, use cases & tips that you can implement.

LEARN MORE

23 September 2020 | CUSTOMER STORIES

1 min read

Data & Digital Futures: MoH View

The Ministry of Health’s data governance manager Simon Ross provides guidance into getting more value from the safe and effective use of data by developing a Health Data Strategy.

LEARN MORE

23 September 2020 | NEWS

1 min read

Counties Clinicians Qlik For Data

Providing organisations with more affordable entry into the world of data analytics, the potential provided to other healthcare organisations is outlined by CM Health and Waitematā DHBs CIO Stuart Bloomfield and CM Health Clinical Director of Information Systems Tina Sun.

LEARN MORE

23 September 2020 | CUSTOMER STORIES

1 min read

Ministry Visualises Mental Health and Addiction Data

The Ministry of Health developed a data tool that provides insight into mental health and addiction issues experienced by New Zealanders. The application incorporates data from the Ministry, DHBs, PHOs and NGOs using sources such as medication dispensing, hospitalisations and social outcome indicators.

LEARN MORE

23 September 2020 | CUSTOMER STORIES

1 min read

Data and the Pandemic – Waitematā’s Story

From uncovering the potential extent of the Covid-19 outbreak and its impact, through developing a view of hospital capacity and occupancy to developing a regional data store with all testing information in three weeks, Armstrong provides fascinating insight into the process and tools used to manage it.

LEARN MORE

1 September 2020 | RESOURCES

5 min read

Getting Started with Cloud-based Data Analytics

Organisations are leveraging cloud-based data analytics solutions for the flexibility and scalability they provide, but security is still a significant hurdle to cloud migration. Explore Challenges of user authentication and authorisation.

LEARN MORE

1 September 2020 | RESOURCES

4 min read

Is Your Company Culture Prepared for Cloud Data Analytics?

Organisations are migrating data to the cloud to reap the benefits, but it’s essential to consider how your people and systems will be impacted by a new data pipeline and what tools and training will be involved if you move to a more automated analytics platform.

LEARN MORE

1 September 2020 | RESOURCES

3 min read

Why Data Collaboration is a Necessity for Strategic Decision-Making

Without company-wide visibility into data, it’s difficult or even impossible for leaders to make data-driven decisions outside of departmental bubbles. This challenge is especially transparent in verticals.

LEARN MORE

6 August 2020 | NEWS

10 min watch

New and Exciting Partnerships

Leading technologies, Qlik, Snowflake and DataRobot provide scalable and automated data platforms as well as automated advanced analytics/machine learning. Ensuring there is excellent integration to facilitate the use of scalable real-time analytics.

LEARN MORE

6 August 2020 | WEBINARS

1 min read

QlikWorld Online 2020 – Watch OnDemand

The easiest way to explore and access the Qlikworld 2020 sessions on demand is through the session guide Qlik Application. The app also displays guides from Qlik Experts and Luminaries to find what you may have missed.

LEARN MORE

6 August 2020 | RESOURCES

2 min read

Geo Analytics Capabilities You Never Knew You Had

Qlik GeoAnalytics not only provides comprehensive mapping capabilities but also moves beyond visualisation with built-in spatial analysis support for a broad range of advanced geoanalytic use cases.

LEARN MORE

17 June 2020 | RESOURCES

1 min read

Qlik Sense Update Bug Fix

Bug with Qlik Sense after upgrading from November 2018 to April 2020. With each release, Qlik has been adding new product features as well as performance, stability and security additions.

LEARN MORE

17 June 2020 | NEWS

1 min read

Acumen BI Wins Qlik Partner Award

The award is presented to the leading Qlik solution partner from the Asia Pacific region and recognises outstanding achievement in the areas of innovations and joint customer success with Qlik.

LEARN MORE

19 May 2020 | NEWS

1 min read

Qlik & Acumen BI New Releases – April 2020

We are pleased to announce the new April 2020 releases for Qlik Sense and Qlik NPrinting! With each release, Qlik has been adding new product features as well as performance, stability and security additions.

LEARN MORE

18 May 2020 | WEBINARS

160 min watch

Innovation & Analytics Strategy – Webinar (Donald Farmer)

Donald Farmer discusses the Principle of TreeHive Strategy. Explore how to define and measure innovation in a very practical way, enabling teams to quickly and effectively become more innovative.

LEARN MORE

4 March 2020 | CUSTOMER STORIES

8 min read

CCDHB Customer Story

As services experience an increase in the acuity of patients, we need to increase care capacity – ensuring we have the right nurses in the right place. To met these aims we need a deeper understanding of the needs of patients and detailed insights about our nurses and midwives.

LEARN MORE

25 February 2020 | RESOURCES

3 min read

Qlik NPrinting: On-Demand

Qlik NPrinting reports can be run ‘On-Demand’ directly from your Qlik Sense applications, giving you the ability to generate PDF, Excel, Word and Power Point reports directly from within a Qlik Sense application based on your selections and template.

LEARN MORE

16 February 2020 | CUSTOMER STORIES

1-2 min read

Clinical Excellence Metrics

Roll out of the new Qlik Sense Data Discovery (business intelligence) tool commenced in January 2017 and we are incrementally incorporating clinical metrics in the tool.

LEARN MORE

16 February 2020 | CUSTOMER STORIES

6 min read

Data Discovery: Using Qlik Sense for Care Redesign

Using Qlik Sense to provide timely acess to meaningful data that can be used for the redesign of care, implementation of evidence-based practice and continuous improvement. Making data accessible in a timely, more organised manner will mean clinicians do not have to spend their limited, non-clinical time making multiple data extracts and data report requests and sifting through large volumes of data.

LEARN MORE

16 February 2020 | NEWS

4 min watch

Special Qlik pricing for NZ Healthcare sector

The Ministry of Health and National District Health Boards CIO Forum has partnered with Acumen BI and Qlik to deliver a Health Sector Pricing Model that will benefit all DHBs, national and regional health bodies, public health organisations and associated health non-governmental organisations.

LEARN MORE

16 January 2020 | RESOURCES

2-3 min read

Qlik NPrinting: Complex Conditional Formatting

With Qlik NPrinting, you can present information with the same formatting as in your Qlik application. By default, Qlik NPrinting attempts to preserve the original formats of imported Qlik objects.

LEARN MORE

4 December 2019 | WEBINARS

100 min watch

Emergency Department – Webinar (Waitemata DHB)

In this webinar Waitematā District Health Board’s Dr Stefan van der Walt presents an overview of the DHB Emergency Department’s data Journey. Learn their insights into data driven patient care, better ED flow and improved patient outcomes.

LEARN MORE

13 November 2019 | RESOURCES

2 min read

Tailored reports in your preferred format

Qlik NPrinting allows you to create and distribute reports using your Qlik Application data. Reports can be shared in many formats, such as Excel, Word, PowerPoint, PixelPerfect, HTML, and PDF; read on to understand the benefits of the different format options.

LEARN MORE

16 October 2019 | WEBINARS

50 min watch

Complex Data Modelling to Answer Clinical Questions – Webinar (Waitemata DHB)

Waitemata DHB address interoperability between key clinical systems by creating complex data models.

LEARN MORE

11 October 2019 | WEBINARS

60 min watch

Analytical Operations Centre Blueprint – Webinar (Morecambe Bay NHS Foundation Trust)

Rob O’Neill presents an overview of their data-driven Operations Centre developed and deployed on the Qlik platform.

LEARN MORE

24 September 2019 | WEBINARS

40 min watch

Human Resource Analytics from AMS Payroll – Webinar (Capital and Coast DHB)

Capital and Coast District Health Board present the recently released HR Analytics Dashboard and Qlik Applications which have resulted in data being presented to a wide range of users in ways previously not possible.

LEARN MORE

24 September 2019 | WEBINARS

35 min watch

Delivering value through Procurement Analytics – Webinar (healthAlliance FPSC)

Delivering value to health through Procurement Analytics, showcasing reduced repetitive manual reporting effort for the procurement Supplier Relationship Management (SRM) programme.

LEARN MORE

28 January 2019 | CUSTOMER STORIES

From Gatekeepers to Shopkeepers

Objectives, goals priorities and next steps of implementing QlikSense at the Ministry of Health, making it easier for people to access the information they need, while keeping the information safe.

LEARN MORE

Have Questions? Reach out for a no-obligation chat.

"*" indicates required fields

Name*
This field is for validation purposes and should be left unchanged.